Monitoring disk, CPU, and memory with OMS
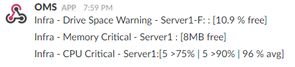
In the previous post we built an OMS to Slack function app to alert on high CPU usage. We'll now extend that so we have alerts in place to cover us for the infrastructure basics - CPU, Memory and Drive Space.
The final code for the functions and example payloads are available in this GitHub repo.
OMS Alerts
These are designed to run over a 5 minute period, every 5 minutes, alerting on 3 consecutive breaches.
As we're building metric alerts OMS expects us to produce a single metric grouped by a single value - as such the Disk Space alert is grouping based on the server name concatenated with the drive letter. Grouping by ComputerName, InstanceName (which is what we're really interested in) will prevent the alert from firing altogether.
CPU Usage (%)
Perf
| where CounterName == "% Processor Time"
| summarize AggregatedValue = avg(CounterValue) by bin(TimeGenerated, 1m), Computer
Disk Space Available (%)
Perf
| where ObjectName == "LogicalDisk"
| where CounterName == "% Free Space" and InstanceName != "_Total"
| extend ServerDrive = strcat(Computer,"-",InstanceName)
| summarize AggregatedValue = min(CounterValue) by bin(TimeGenerated, 1m), ServerDrive
Memory Available (MB)
Perf
| where CounterName == "Available MBytes"
| summarize AggregatedValue= avg(CounterValue) by bin(TimeGenerated, 1m), Computer
Functions
To keep things simple I've built one function app per-alert, all following the basic pattern from the CPU alert built in the previous post. The table below summarises the alerts and links to the example payload generated by the OMS alert, as well as the text of the function.
| Alert | Payload | Function | Measure | Warning | Critical |
|---|---|---|---|---|---|
| CPU | cpu-payload.json | CPUToSlack.csx | CPU Used % | 75 | 90 |
| Memory | memory-payload.json | MemoryToSlack.csx | Free Memory MB | 10,000 | 5,000 |
| Disk Space | drive-payload.json | DriveToSlack.csx | Free Space % | 10 | 5 |
If you choose to modify the thresholds then you'll need to ensure you modify them both in the OMS alert definition (under the 'Metric Measurement' section), as well as in the custom payload that specifies the warning/critical thresholds (under the 'Webhook' section).
Next steps
Now you've got monitoring in place for CPU, Memory and Disk for your whole estate you're probably interested in the fan-out/decoupling of trigger/response I mentioned in the previous post. We'll get there soon, though in the next post we'll look at migrating the script functions into a class library, and reducing a bit of duplication.