Building an OMS metric alert to Slack bridge with Azure functions
Previously we deployed a function app with three functions to send Slack notifications for OMS alerts based on CPU, memory, and disk. We'll now deploy a function with a single function designed to handle any OMS metric alert and send it to slack. As an added bonus we'll also support:
- Overriding the thresholds to alert/critically alert based on server + metric
- Use @channel to notify for critical alerts
- Sending alerts to multiple channels based on either server or metric name
- Configuring defaults directly in the OMS alert, allowing rapid deployment of new alerts
If you want to get started quickly:
- You can grab a copy of the finished function app from this repo which you'll need to deploy as an Azure function (updating the Slack endpoint in SlackHelper.cs)
- Configure your alerts using the examples shown at the bottom
Otherwise, read on for more details on what the function looks like, and more details on configuring the alerts and overrides.
Solution Overview
- The solution is comprised of one or more alerts in OMS, an Azure function, and a Slack endpoint
- When an alert is raised in OMS it calls our Azure function via a webhook and passes the alert configuration along with the alert search results that raised the alert
- The Azure function uses the configuration and any deployed overrides to determine whether or not to alert, what channels to send the alert to, and whether or not to notify the channel (@channel)
Configuring the OMS alert
For every metric you want to alert on an OMS alert must be configured. While you can use almost any query you want to trigger an alert, there are a few things you'll have to do for each alert to get it to correctly route through the Azure function:
- The alert must be a metric alert (trigger based on metric measurement rather than number of results)
- The search query must only group by one value in addition to TimeGenerated (typically ComputerName, though in some cases you might have a Computer + InstanceName, in which case you should concatenate them with a pipe (Computer|InstanceName))
- If you group by more than one value the alert will not fire in OMS
- The alert must specify a webhook
- Has to specify a webhook action
- The webhook must contain a custom JSON payload that contains all the parameters expected by the Azure function (see Custom JSON payload)
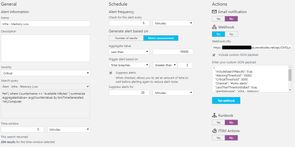
Example OMS Alert
Note that this example contains defaults appropriate for my environment - you may wish to modify the frequency of checks, thresholds, and suppressions.
Search Query
Perf
| where CounterName == "Available MBytes"
| summarize AggregatedValue= avg(CounterValue) by bin(TimeGenerated, 1m), Computer
Alert Settings
- Time Window: 5 minutes
- Alert Frequency: 5 minutes
- Generate alert based on: Metric measurement
- Aggregate value: Less than 10,000
- Trigger alert based on: Total breaches greater than 3
- Suppress alerts for: 20 minutes
Custom JSON payload
The custom JSON payload contains both generic information about the alert (how to format the numbers, what the alert is) as well as defaults for what constitutes a warning or critical alert.
{
  "IncludeSearchResults": true,
  "WarningThreshold": 10000,
  "CriticalThreshold": 5000,
  "ValueMultiplier": 1.0,
  "Channel": "#oms-alerts",
  "LessThanThresholdIsBad": true,
  "AlertMessage": "Infra - Memory",
  "MetricName": "Free Megabytes",
  "FormatString": "N0",
  "ObservationThreshold": 4
}
All parameters are mandatory (if you don't specify them the function will fail). Note that you cannot test the webhook by using the 'Test Webhook' button as it will not include the search results.
OMS Parameters
- IncludeSearchResults: This must always be set to true so that the search query results will be included in the payload
Alert Information
- LessThanThresholdIsBad: When true the aggregate value is compared against the warning/critical thresholds with a LessThan operator. When false GreaterThan is used.
- ValueMultiplier: The value to multiply each metric value by before comparing to thresholds of formatting. Typically 1.0 or 0.01 (most perfmon counters report 50% as 50 rather than 0.5, which when formatted as P0 would show 5000%)
- AlertMessage: The start of the message sent to the slack channel - see below for examples
- FormatString: How the metric should be formatted, takes a .Net format string
- ObservationThreshold: At least this many observations must be above (below) the threshold to trigger the alert (or upgrade from warning to critical)
- MetricName: The name of the metric - this is included in the Slack notification
Alert Defaults
These can be overridden by the function based on the server/metric.
- WarningThreshold: The value which if the metric is above (below) the function app won't send a Slack notification
- CriticalThreshold: The value which if the metric is above (below) the function app will mark that notification as critical
- Channel: The default channel for this alert. Channels can be added to but never removed from an alert.
WarningThreshold, LessThanThresholdIsBad will typically mirror the settings of the alert in OMS, while ObservationThreshold is typically one more than its corresponding OMS value.
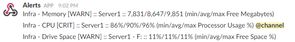
Sample Messages
Assuming Server1 was low on memory, the warning & critical alerts based on the configuration above might look like this:
Infra - Memory [WARN] :: Server1 :: 9,400/9,500/9,600 (min/avg/max Free Megabytes)

Infra - Memory [CRIT] :: Server1 :: 3,400/3,500/3,600 (min/avg/max Free Megabytes
Sample OMS Alert Configs
CPU
Alerts when CPU exceeds a threshold.
Infra - CPU [CRIT] :: Server1 :: 56%/59%/61% (min/avg/max Processor Usage %)
Search Query
Perf
| where CounterName == "% Processor Time"
| summarize AggregatedValue = avg(CounterValue) by bin(TimeGenerated, 1m), Computer
JSON
{
  "IncludeSearchResults": true,
  "WarningThreshold": 0.35,
  "CriticalThreshold": 0.45,
  "ValueMultiplier": 0.01,
  "Channel": "#oms-alerts",
  "LessThanThresholdIsBad": false,
  "AlertMessage": "Infra - CPU",
  "MetricName": "Processor Usage %",
  "FormatString": "P0",
  "ObservationThreshold": 3
}
Memory
Alerts when free memory drops below a threshold. Measured in megabytes.
Infra - Memory [WARN] :: Server1 :: 9,400/9,500/9,600 (min/avg/max Free Megabytes)
Search Query
Perf
| where CounterName == "Available MBytes"
| summarize AggregatedValue= avg(CounterValue) by bin(TimeGenerated, 1m),Computer
JSON
{
  "IncludeSearchResults": true,
  "WarningThreshold": 10000,
  "CriticalThreshold": 5000,
  "ValueMultiplier": 1.0,
  "Channel": "#oms-alerts",
  "LessThanThresholdIsBad": true,
  "AlertMessage": "Infra - Memory",
  "MetricName": "Free Megabytes",
  "FormatString": "N0",
  "ObservationThreshold": 4
}
Disk
Alerts when a logical volume drops below a percentage threshold of free space. Note we group by a custom value (Computer + pipe + InstanceName).
Infra - Disk [WARN] :: Server1 - C: :: 5%/5%/5% (min/avg/max Free Space %)
Search Query
Perf
| where ObjectName == "LogicalDisk"
| where CounterName == "% Free Space" and InstanceName != "_Total"
| extend ServerDrive = strcat(Computer,"|",InstanceName)
| summarize AggregatedValue = min(CounterValue) by bin(TimeGenerated,5m), ServerDrive
JSON
{
  "IncludeSearchResults": true,
  "WarningThreshold": 0.2,
  "CriticalThreshold": 0.1,
  "ValueMultiplier": 0.01,
  "Channel": "#oms-alerts",
  "LessThanThresholdIsBad": true,
  "AlertMessage": "Infra - Disk",
  "MetricName": "Free Space %",
  "FormatString": "P0",
  "ObservationThreshold": 3
}
The Azure Function
The flow of a webhook through the Azure function is:
- Webhook with alert configuration (custom JSON) and alert results (SearchResults) calls the OMSMetricToSlack function
- OMSMetricToSlack parses the data into an Alert object and then passes that to the AlertProcessor
- AlertProcessor determines the Computer name (we could be dealing with either a Computer or some combination of Computer + other value)
- AlertProcessor looks up any threshold overrides for the combination of Computer + Metric (could be higher/lower)
- AlertProcessor compares the metrics against the thresholds, and if ObservationThreshold number of values exceed threshold values the alert is set as warning or critical
- If the alert is neither a warning or a critical nothing further happens
- AlertProcessor builds the list of channels to send to, starting with the default channel from the alert config and adding any additional channels from computer or metric name overrides
- AlertProcessor builds a message and sends the message to every channel
OMSMetricToSlack
public class OMSMetricToSlack
{
    [FunctionName("OMSMetricToSlack")]
    public static async Task<object> Run([HttpTrigger(WebHookType = "genericJson")]HttpRequestMessage req, TraceWriter log)
    {
        var data = await req.Content.ReadAsAsync<OMSPayload>();

        var metrics = data.SearchResults.Tables[0].Rows.Select(r =>
        {
            return new MetricValue(DateTime.Parse(r[0].ToString()), Double.Parse(r[2].ToString()) * data.ValueMultiplier);
        });

        // Server1|E:
        var computerName = data.SearchResults.Tables[0].Rows[0][1].ToString();
        string instanceName = null;

        if(computerName.Contains('|'))
        {
            var split = computerName.Split('|');
            computerName = split[0];
            instanceName = split[1];
        }

        var alert = new Alert(
            data.Channel
            , data.WarningThreshold
            , data.CriticalThreshold
            , data.LessThanThresholdIsBad
            , data.AlertMessage
            , data.MetricName
            , data.FormatString
            , computerName
            , instanceName
            , data.ObservationThreshold
            , metrics
        );

        AlertProcessor.ProcessAlert(alert);

        return req.CreateResponse(HttpStatusCode.OK);
    }
}
AlertProcessor
The example alert processor class below contains a few overrides:
- For the database servers, we want to warn when CPU exceeds 30%, and critically alert when CPU exceeds 50%
- For the app servers, we want to warn when CPU exceeds 60%, and critically alert when CPU exceeds 85%
- We want to send all database server alerts to the #database channel in addition to whatever the default channel is
- We want to send all alerts based on SQL Batch Requests/second to the #database channel too
Note that the Computer should match exactly the name of the computer in OMS (case sensitive). The name of the performance counter is not the name of the performance counter in OMS, it is the value you've given to the MetricName property in the alert configuration. Take care to ensure you do not give duplicate metric names to different alerts.
public static class AlertProcessor
{
    private static Func<double, double, bool> LessThan = (double value, double threshold) => { return value < threshold; };
    private static Func<double, double, bool> MoreThan = (double value, double threshold) => { return value > threshold; };

    public static async void ProcessAlert(Alert alert)
    {
        // Is this a < or > alert?
        var comparison = alert.LessThanThresholdIsBad ? LessThan : MoreThan;

        // Machine-specific overrides?
        var (critical, warning) = GetMachineDefaultThresholdOverrides(alert.MachineName, alert.MetricName);
        var criticalThreshold = critical ?? alert.DefaultCriticalThreshold;
        var warningThreshold = warning ?? alert.DefaultWarningThreshold;

        // Where should the alert go
        IEnumerable<string> channels = new List<string>() { alert.DefaultChannel };
        channels = channels.Union(GetMachineChannels(alert.MachineName));
        channels = channels.Union(GetMetricChannels(alert.MetricName));

        // Aggregate metrics to produce a single summary record
        var totals = alert.MetricValues.GroupBy(_ => 1).Select(g => new
        {
            Average = g.Average(m => m.Value)
            ,Min = g.Min(m => m.Value)
            ,Max = g.Max(m => m.Value)
            ,Critical = g.Count(m => comparison(m.Value, criticalThreshold))
            ,Warning = g.Count(m => comparison(m.Value, warningThreshold))
        }).Single();

        // Determine alert criticality
        var isWarning = totals.Warning >= alert.ObservationThreshold;
        var isCritical = totals.Critical >= alert.ObservationThreshold;

        // If the alert doesn't cross the warning threshold return
        if(!isWarning)
        {
            return;
        }

        // Build message
        // Infra - CPU [CRIT] :: Server1 :: 56%/59%/61% (min/avg/max Processor Usage %)
        // Infra - Disk [WARN] :: Server1 - E: :: 5%/6%/6% (min/avg/max Free Space %)
        var instance = string.IsNullOrWhiteSpace(alert.InstanceName) ? "" : $" - {alert.InstanceName}";
        var message = $"{alert.DefaultAlertMessage} [{(isCritical ? "CRIT" : "WARN")}] :: {alert.MachineName}{instance} :: ";
        message += $"{totals.Min.ToString(alert.FormatString)}/{totals.Average.ToString(alert.FormatString)}/{totals.Max.ToString(alert.FormatString)} ";
        message += $"(min/avg/max {alert.MetricName})";

        if (isCritical)
        {
            message += " @channel";
        }

        // Send message
        foreach (var channel in channels)
        {
            await SlackHelper.SendSlackMessage(channel, message);
        }
    }

    private static (double? warningThreshold, double? criticalThreshold) GetMachineDefaultThresholdOverrides(string machineName, string metricName)
    {
        var combined = $"{machineName}|{metricName}";

        switch(combined)
        {
            case "DatabaseServer1|Processor Usage %":
            case "DatabaseServer2|Processor Usage %":
            case "DatabaseServer3|Processor Usage %":
                return (0.3, 0.5);
            case "AppServer1|Processor Usage %":
            case "AppServer2|Processor Usage %":
                return (0.6, 0.85);
            default:
                return (null, null);
        }
    }

    private static IEnumerable<string> GetMachineChannels(string machineName)
    {
        switch (machineName)
        {
            case "DatabaseServer1":
            case "DatabaseServer2":
            case "DatabaseServer3":
                return new List<string>() { "#database" };
            default:
                return new List<string>();
        }
    }

    private static IEnumerable<string> GetMetricChannels(string metricName)
    {
        switch (metricName)
        {
            case "SQL Batch Requests/sec":
                return new List<string>() { "#database" };
            default:
                return new List<string>();
        }
    }
}
SlackHelper
Ensure you replace the slackUri with your own Slack endpoint.
public static class SlackHelper
{
    public static async Task SendSlackMessage(string slackChannel, string message)
    {
        var slackUri = "https://requestb.in/1hoo74a1";
        var slackUsername = "Alerts";

        using (var client = new HttpClient())
        {
            System.Diagnostics.Debug.WriteLine($"{slackChannel} - {message}");

            var slackPayload = new SlackMessage() { Text = message, Channel = slackChannel, Username = slackUsername, LinkNames = true };
            var hook = new StringContent(JsonConvert.SerializeObject(slackPayload), Encoding.UTF8, "application/json");
            var response = await client.PostAsync(slackUri, hook);
        }
    }
}
Extending the solution
The solution is fairly robust and is fairly flexible in allowing you to alert on anything you can write a search query on. Some examples of things you might want to do with the function to help manage/debug/extend it are:
- Add logging via calls to log.Info(...) or adding Application Insights to the function
- Create additional test payloads to ensure your overrides are working as expected
- Add some unit tests to verify the overrides
- Support case insensitive, wildcard, regex, etc., overrides for computer name
- Load configuration from a config file/Azure table storage
- Add additional notification methods, potentially using Azure function integrations
One of the easiest ways to get alerting wrong is to configure yourself into never receiving alerts, so I would suggest before you go too crazy with your config you come up with some way of testing what you're coding in.
Happy alerting!