Building better OMS alerts with function apps
OMS (Operations Management Suite) allows you to easily build infrastructure alerts to tell you when a server is using a lot of CPU, low on disk space, etc., but if you've tried to use the alerts to trigger webhooks to something like Slack you've probably come across a pretty painful limitation - getting the name of the computer that triggered the alert can't be done dynamically, meaning you either have to settle for an alert which tells you "One of your computers is using a lot of CPU!", or create one alert per-computer, and hardcode the computer name into the alert.
We'll use a simple function app to not only report which server triggered the alert, but have far more granular control over what we report in Slack:
If you want to skip straight to the final code it is available in this GitHub repo.
Pre-requisites
- An OMS account (info)
- At least one machine reporting % Processor Usage to OMS
- An Azure function app (info)
- A Slack account with an incoming webhook endpoint configured (info)
Getting all these configured is beyond the scope of this blog post.
Configuring the OMS alert
We're going to configure an OMS alert to fire when CPU utilisation is high. The values I'm using for thresholds/timings are useful in my current environment and might not be right for you - modify as required. The query we'll base our alert off is:
Perf
| where CounterName == "% Processor Time"
| summarize AggregatedValue = avg(CounterValue) by bin(TimeGenerated, 1m), Computer
If you look at this query in Log Analytics you'll see it returns the per-minute CPU utilisation for every machine linked to your OMS account. We're going to set our alert to evaluate this query every 5 minutes, and look at the prior 5 minutes of data. In our environment we want to know any time a single computer exceeds our threshold for CPU % for 3 consecutive minutes. The thresholds we've established to trigger a warning is 75%. We also want to suppress any alerts following a trigger for 20 minutes (to prevent spam). In the OMS alert editor that looks like this:
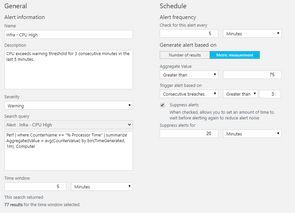
The way alerting & suppression works is per-machine. This means that if two different machines are see-sawing around the threshold such that one of them is always above and the other is always below, this alert will not fire. This is the behaviour we want - only alert us when a single machine stays above the threshold for 3 measurement periods. Make sure you take your measurement period into account when building alerts - if you measure CPU every 5 minutes only it won't make any sense to look at per-minute granularity.
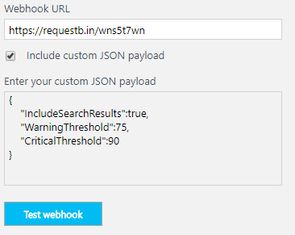
The final part of configuring the OMS alert is to configure the outbound webhook that OMS will call every time the alert fires. Note that if multiple machines trigger the alert in a single evaluation period, OMS will trigger the alert once for every machine.
While testing I suggest you use RequestBin to capture the data that OMS sends. When configuring the webhook ensure you check the include custom JSON payload option, and add the following JSON:
{
  "IncludeSearchResults": true,
  "WarningThreshold": 75,
  "CriticalThreshold": 90
}
The IncludeSearchResults tells OMS that we want the search results generated to be included in the webhook payload. OMS will only include the search results for the machine which has triggered the alert. You can see an example of the payload generated in this payload file.
The warning & critical threshold values are provided for use in function app, and we'll use them to allow us to have a single OMS alert for both warning & critical, rather than having to create two alerts.
When correctly configured your OMS webhook config will look like this (though with your only RequestBin URL/function app URL):
You can test the webhook, though OMS will not run the query and include the search results. If you want to see what the search results look like you'll need to let the alert fire - set your threshold to something low (e.g. 1%) and the alert will fire within a few minutes.
Building the Function app
Create a new function app using C# Webhook template. The template also creates HTTP output, though we're not going to use that so you can delete it, leaving your function app with a HTTP trigger only.
We'll create a few helper classes to work with the incoming data from OMS, as well as create our Slack webhook. To build the OMS classes I used json2csharp.com, and pasted into the JSON payload from OMS. This generates a pretty verbose class, which you can strip back to the below.
public class OMSPayload
{
    public int WarningThreshold { get; set; }
    public int CriticalThreshold { get; set; }
    public SearchResults SearchResults { get; set; }
}

public class SearchResults
{
    public List<Table> Tables { get; set; }
}

public class Table
{
    public string TableName { get; set; }
    public List<Column> Columns { get; set; }
    public List<List<object>> Rows { get; set; }
}

public class Column
{
    public string ColumnName { get; set; }
    public string DataType { get; set; }
    public string ColumnType { get; set; }
}
In order to send a message to Slack we'll use a fairly simple class:
public class SlackMessage
{
    public string text { get; set; }
    public string channel { get; set; }
    public string username { get; set; }
}
The function app is going to:
- Parse the OMS JSON into the classes above
- Determine if we're in a warning or critical state
- Extract the name of the computer alerting
- Build a message with the computer name and some simple metrics
- Send the message to Slack
The full text of the function (assuming the default input name of req) is below. Note this excludes the class definitions above, which would normally go at the bottom of the file.
#r "Newtonsoft.Json"

using System;
using System.Net;
using System.Collections;
using Newtonsoft.Json;
using System.Text;

public static async Task<object> Run(HttpRequestMessage req, TraceWriter log)
{
    var slackUri = "https://requestb.in/su78d1su";
    var slackChannel = "#webhook-tests";
    var slackUsername = "OMS";
    var criticalMeasurementCount = 3;

    var data = await req.Content.ReadAsAsync<OMSPayload>();

    var warningThreshold = data?.WarningThreshold ?? 75;
    var criticalThreshold = data?.CriticalThreshold ?? 90;

    var aggregatedResults = data.SearchResults.Tables[0].Rows.GroupBy(r => r[1].ToString())
                            .Select(g => new {  Computer = g.Key
                                                ,Average = g.Average(r => Double.Parse(r[2].ToString()))
                                                ,Warning = g.Count(r =>  Double.Parse(r[2].ToString()) >= warningThreshold)
                                                ,Critical = g.Count(r =>  Double.Parse(r[2].ToString()) >= criticalThreshold) });

    var message = string.Empty;
    var critical = false;

    foreach(var result in aggregatedResults)
    {
        message +=  $" - {result.Computer}:[{result.Warning} >{warningThreshold}% | {result.Critical} >{criticalThreshold}% | {(result.Average/100):P0} avg]";

        if(result.Critical >= criticalMeasurementCount)
        {
            critical = true;
        }
    }

    message = $"Infra - CPU {(critical ? "Critical" : "Warning")}" + message;

    using(var client = new HttpClient())
    {
        var payload = new SlackMessage() { text = message, channel = slackChannel, username = slackUsername };
        var hook = new StringContent(JsonConvert.SerializeObject(payload), Encoding.UTF8, "application/json");
        var response = await client.PostAsync(slackUri, hook);
    }

    return req.CreateResponse(HttpStatusCode.OK);
}
If all of the code and class definitions are present in the same file in the function app (run.csx) you should now be able to test this with the sample payload from OMS, or point OMS directly at the function.
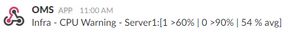
The format of the message produced is:
Infra - CPU Severity - ServerName:[WarnCount >Warn% | CritCount >Crit% | Mean % avg]
Where WarnCount is the number of times in the sampling period that the metric exceeded Warn, and CritCount the same for Crit. In the below example message we can see the severity is critical, and that 5/5 measures exceeded the warning threshold of 60%, and 5/5 measures exceeded the critical threshold of 90%. This server doesn't look too healthy!
Infra - CPU Critical - Server1:[5 >60% | 5 >90% | 100 % avg]
You'll notice the code also uses a RequestBin for testing the Slack alerts. When you're done testing both the OMS webhook URL and the Uri specified in the Function app should point to their live endpoints.
Next steps
As configured, the solution will now start routing Slack alerts to your chosen channel, enriched with information from the search results included with each alert. In the future we'll extend the solution to support fan-out (1 alert notifying multiple channels), notifications (conditional @channel to get attention), and decoupling the notification from the trigger.
Updated 2017-09-08 for new OMS query language/search payload.