Troubleshooting a slow application with Application Insights
Application Insights (AppInsights) is a fantastic instrumentation framework that with minimal/zero configuration will start giving you rich data about your application's performance.
We recently got some reports that one of our website solutions was 'slow' when developing locally, and as much as we'd like to turn to the DBA (which can often stand for Database Blamed Always...), with AppInsights we can be a little more rigorous.
From our starting point of 'it runs slow locally, I think it is the database' we'll figure out precisely how slow it is, and whether it really is the database or not.
Investigating with the portal
After navigating to the AppInsights resource that holds our development telemetry, we select the performance blade.
We prefer to split our telemetry so that the production environment has its own resource, and that all DevTest resources go to their own resource.
We can now to navigate to the time period where the application was misbehaving (slow), and then filter out all of the roles and instances we don't care about.
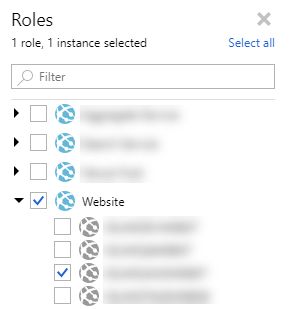
In our case we drilled down to select the frontend website application, and the development machine which reported the problem.
The performance blade gives an overview of the call count & duration of each endpoint (e.g. /Items/Detail, /Account/Login), and we can quickly see that a few endpoints had really poor performance - 4 minutes to load one page. Discrepancies between production and local development are to be expected (none of our development team run any 64-core machines), but 4 minutes is pretty extreme.
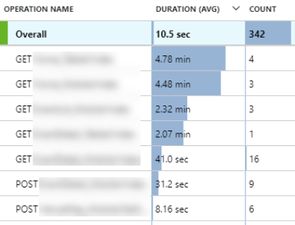
These are all server-side response times. AppInsights also supports client side monitoring.
From here we can either drill into that single slow call, or take a look at overall dependency performance.
Overall dependencies
AppInsights will track every outbound dependency made by the application, giving us access to individual calls (e.g. this call at time T took 12ms) but also aggregate summaries.
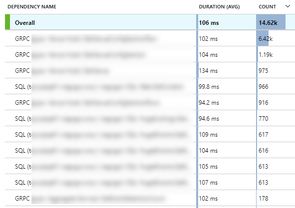
From the dependencies view we see a breakdown of every outbound call with the call count and average duration. You'll need to know what 'normal' looks like for your application, or at least have a rough idea of what to expect (volume of calls and expected response time). Looking at this view it was clear there was an issue with dependencies - call times I was expecting to be <10ms (in this environment) were running at almost 100ms.
Flipping between a machine that wasn't suffering the problems and the problematic machine revealed the 'slow' machine was almost 5-10x slower than the normal machine. You can be done via the portal (selecting a different instance), or by dropping into the Analytics portal and querying a few different machines:
let start=datetime("2018-07-30T15:00:00.000Z");
let end=datetime("2018-07-30T17:00:00.000Z");
dependencies
| where timestamp > start and timestamp < end
| where cloud_RoleInstance == 'SLOW_PC_HOSTNAME') // or 'FAST_PC_HOSTNAME'
| where (cloud_RoleName == 'Website'
| summarize count_=sum(itemCount), avg(duration), percentiles(duration,50,95) by target, name
Looking at averages as well as the median and 95th percentile shows us that this isn't some long-tail of slow requests pushing up the mean, but that all of our requests are slow. The problem is impacting all dependencies (e.g. GRPC), not just the database.
AppInsights doesn't capture GRPC dependencies out of the box, but it does capture SQL and HttpClient calls.
Looking at an individual request
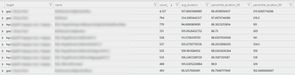
Another way to troubleshoot is to examine what happened in the context of a single request. If a dependency is called as part of a request, AppInsights will link the two together. By selecting one of the slow endpoints in the Overall view we can then see a list of all the sample operations AppInsights has captured.
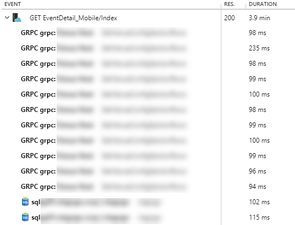
Clicking on any sample shows a timeline for the operation, including all the dependency calls associated with that operation. Picking a slow example (the 4 minute one) we can see again this isn't one slow dependency - they're all slow (and what you can't see below is a long vertical scrollbar!).
AppInsights by default turns every request into an operation. If you're instrumenting a windows service you'll need to create and track your own operations if you want to see them show up in the Overall view with dependencies tagged to their parent operation. See more in the Telemetry Correlation docs.
As with the overall view we can drop down to Analytics to query the raw data for a single operation:
dependencies
| where operation_Id == "oPerAtionId="
| summarize sum(itemCount), avg(duration) by target, name
| order by sum_itemCount desc
Note that we sum(itemCount) rather than count() because of automatic sampling. If there is no sampling this has no impact on your results, but if your data is being sampled and you don't sum(itemCount), your numbers will be off!
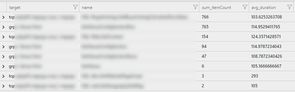
This analysis tells us the same story as the overall view - that all dependencies seem to be slow. This view additionally tells us that we might have an N+1 problem somewhere due to the number of dependency calls being made with each operation.
The verdict
AppInsights is fantastic for pinpointing issues, but it can't root cause for you (yet?). In this case I already had a pretty good idea of what the problem was, and we used AppInsights to confirm it.
The slow development machine was located on the other side of the Atlantic from the development services it was configured to talk to! While some of our engineering team are working on increasing the speed of light, the short term fix we implemented was to target services local to the development machine.
The examples above are just the tip of the iceberg when it comes to diagnosing application performance (whether through the portal, using workbooks, or via Analytics - you can quickly ask and get answers to some incredibly detailed questions).
AppInsights is moving pretty quickly (every few months a new feature or experience pops up), and in the last 12 months we've seen Log Analytics and AppInsights Analytics converge to support the Kusto Query Language (KQL), and so it is worth keeping an eye on the Application Insights Blog.