Saving and reporting on Pester Infrastructure test results in Log Analytics
Pester is a fantastic tool to test and monitor the status of your infrastructure. There are several libraries which leverage this directly (e.g. SQLChecks, DBAChecks, Operation Validation Framework), and a growing set of resources discussing how to leverage Pester in this fashion (including a Pluralsight course and a chapter in the Pester book). If you don't already have some tests you can run interactively (is my environment correct right now?) I'd suggest you start there first.
Once you've got your infrastructure tests running interactively you'll probably want to start automating them (is my environment correct every day?). And then at some point you'll probably find yourself asking questions like:
- How long has this test been failing for?
- How long does this test normally take to run?
- When was the last time this test failed?
- How is the health of my estate trending over time?
Once you've invested time into building out a library of Pester tests for your infrastructure, what you really want to do is analyse the Pester test results. There are various examples out there that discuss how to persist results to files, XML, SQL databases - but none of these options have the advantages that shipping to Log Analytics provides - which is what we'll discuss today. A few reasons why I think think sending your results to Log Analytics is the superior choice:
- Extremely powerful query language (KQL)
- Can be queried & consumed by a web browser, Power BI, REST API, Flow, Azure Monitor (for alerting)
- Lives with the rest of your infrastructure logs (if you use the machine agents/Azure connectors/etc.)
- Simplified security story (everywhere you run a tests posts to an HTTP endpoint - no fileshares/SQL databases/etc.)
- No impact on the systems under test (how many DBAs have spent time performance tuning their monitoring databases :)?)
- Great operating cost (free tier lets you log a lot of Pester results every month)
If you don't already have a Log Analytics workspace I did a fairly detailed write-up last month: Getting started with Log Analytics and PowerShell logging.
Pester Result Schema
While we could log an absolutely minimal object to Log Analytics, I've found that adding a little more structure is helpful for both debugging and analysing test results.
We'll be building the result objects in PowerShell, and then sending the objects to be stored in a table in Log Analytics. The below table shows the property names, as well as their column name in the table in Log Analytics. Columns are suffixed with their data type when created in Log Analytics, shown below as their LA Name (Log Analytics Name).
| Property | LA Name | Description |
|---|---|---|
| Identifier | Identifier_s | Used to identify groups of Pester results, e.g. SQL Infra, AD Test, Fileshare Tests |
| BatchId | BatchId_g | Unique per batch of tests |
| InvocationId | InvocationId_g | Unique per call to Invoke-Pester |
| InvocationStartTime | TimeGenerated | The time the invocation started |
| InvocationEndTime | InvocationEndTime_t | The time the invocation ended |
| HostComputer | HostComputer_s | The computer running the tests |
| Target | Target_s | The target of the test (e.g. Host, SQL Instance) |
| TimeTaken | TimeTaken_d | The time taken for the test to execute |
| Passed | Passed_b | If the test passed or failed |
| Describe | Describe_s | The describe text for the test |
| Context | Context_s | The context text for the test, if present |
| Name | Name_s | The name text for the test |
| FailureMessage | FailureMessage_s | The error message for the test, if present |
| Result | Result_s | The result of the test |
We're going to map the value of
InvocationStartTimeto the built-in fieldTimeGenerated. If no field is supplied,TimeGenerateddefaults to ingestion time.
The great thing about the Data Collector API is that these fields are all optional, and so if you don't want to use the full schema you don't have to (perhaps your tests won't use context, or you won't care about host/target).
Some columns that deserve a little more explanation are BatchId and InvocationId.
Batches and Invocations
Most infrastructure tests I run tend to come in a format that looks something like the following (pseudocode):
for($thingToTest in $listOfThingsToTest) {
  Invoke-Pester -Script @{ TestParameters = $thingToTest }
}
The execution of the whole script would be a Batch. Every call to Invoke-Pester is a separate Invocation, which can have zero or more test results (technically an invocation has 0..N Describes, each of which has 0..N Contexts, each of which has 0..N Tests).
Being able to look at batches & invocations will let you detect issues like:
- Incomplete batches (a hard-error knocked it out half-way)
- Overall runtime vs. Invocation runtime (vs. test runtime)
Rather than collecting your results and posting them in one go, I would encourage you to post them after every Invoke-Pester call. There are times when your automation will fail, and having incomplete results will assist in telling you how far your batch got before failing (vs. having no results if you wait until the end to try and post them).
With batches and invocations our pseudocode now looks something like this (I've also included an example call to post data to Log Analytics):
$batchId = [System.Guid]::NewGuid()

foreach($thingToTest in $listOfThingsToTest) {
  $invocationId = [System.Guid]::NewGuid()
  $results = Invoke-Pester -Script @{ TestParameters = $thingToTest } -PassThru

  Export-LogAnalytics -Batch $batchId -Invocation $invocationId -Results $results
}
Note the usage of the PassThru switch - this is required to capture the results of the Pester tests in the $results variable.
The
Export-LogAnalyticsfunction is part of SQLChecks, though you can build something very similar with the example PowerShell on the Data Collector API page. You can see the definition of the function on GitHub - ExportLogAnalytics function. The source to the referenced function is also available on GitHub - Get-LogAnalyticsSignature.
Working with the Pester result object
The object returned from Invoke-Pester needs a bit of work to transform it into the schema we outlined above. The $results object contains a property TestResult, which is an array of result objects (one object for every test executed).
Each result object contains information about the Describe, Context, and Test, as well as the result (pass/fail) and timing information. We use the TestResult to build our array of PesterResult objects to sent to Log Analytics:
$results = Invoke-Pester -PassThru
$pesterResults = @()

foreach($testResult in $results.TestResult) {
  $pesterResults += [PSCustomObject]@{
  TimeTaken  = $testResult.Time.TotalMilliseconds
  Passed = $testResult.Passed
  Describe = $testResult.Describe
  Context = $testResult.Context
  Name = $testResult.Name
  FailureMessage = $testResult.FailureMessage
  Result = $testResult.Result
  }
}
# $exportLogAnalyticsArguments contains customerId, sharedKey, etc.
Export-LogAnalytics $pesterResults @exportLogAnalyticsArguments
The above example extracts the data from the Pester test results and no more (missing are things like BatchId, Target, etc.). Note that the above code is perfectly valid and can be used to quickly get started logging results.
A more complex example
A more complete example is shown below - this is taken from SQLChecks which iterates over configuration files and performs one call to Invoke-Pester (wrapped by Invoke-SQLChecks) per file being tested - in this case each file represents an instance of SQL Server.
$batchId = [System.Guid]::NewGuid()

$logAnalyticsArguments = @{
    CustomerId = "xxxxxxxx-xxxx-xxxx-xxxx-xxxxxxxxxxxx"
    SharedKey = "xxxxxxxxxxxxxxxxxxxxxxxxxxxxxx"
    LogType = "PesterResult"
    TimeStampField = "InvocationStartTime"
}

$configs = Get-ChildItem -Filter localhost.config.json -Recurse
foreach($configFile in $configs) {
    $config = Read-SqlChecksConfig $configFile.FullName
    $targetComputer = $config.ServerInstance

    $invocationStartTime = [DateTime]::UtcNow
    $results = Invoke-SqlChecks -Config $config -PassThru -Show None
    $invocationEndTime = [DateTime]::UtcNow

    # If the config has no tests, nothing to post in this batch
    if($results.Count -gt 0) {
        $pesterResults = @()
        foreach($testResult in $results.TestResult) {
            $pesterResults += [PSCustomObject]@{
                BatchId = $BatchId
                InvocationId = [System.Guid]::NewGuid()
                InvocationStartTime = $InvocationStartTime
                InvocationEndTime = $InvocationEndTime
                HostComputer = $env:computername
                Target = $TargetComputer
                TimeTaken = $testResult.Time.TotalMilliseconds
                Passed = $testResult.Passed
                Describe = $testResult.Describe
                Context = $testResult.Context
                Name = $testResult.Name
                FailureMessage = $testResult.FailureMessage
                Result = $testResult.Result
                Identifier = "SQLChecks"
            }
        }

        Export-LogAnalytics @logAnalyticsArguments $pesterResults
    }
}
A more complex example, simplified
Because this is a lot of code to write everywhere you deploy SQLChecks, it has been wrapped into a function - Invoke-SqlChecksToLogAnalytics, which means you can reduce the above example to the following:
$batchId = [System.Guid]::NewGuid()

$logAnalyticsArguments = @{
    CustomerId = "xxxxxxxx-xxxx-xxxx-xxxx-xxxxxxxxxxxx"
    SharedKey = "xxxxxxxxxxxxxxxxxxxxxxxxxxxxxx"
}

$configs = Get-ChildItem -Filter localhost.config.json -Recurse
foreach($configFile in $configs) {
    $config = Read-SqlChecksConfig $configFile.FullName
    Invoke-SqlChecksToLogAnalytics -Config $config -BatchId $batchId @logAnalyticsArguments
}
The definition of the Invoke-SqlChecksToLogAnalytics function shows how you might want to wrap your own infrastructure test library.
Querying results
Once you have some results in Log Analytics you can start to query them. You can get to the query interface via the Azure Portal, and once there to look at our query results we'd write:
PesterResult_CL
| order by TimeGenerated desc
| take 100
Showing recent batches
As there might be many kinds of Pester tests being shipped, we'll typically want to focus on a specific set - we'll use SQLChecks as an example again. The following code will find the most recent batch from the last 7 days, and show all results:
PesterResult_CL
| where TimeGenerated > ago(7d)
| where Identifier_s == "SQLChecks"
| top-nested 1 of BatchId_g by max(TimeGenerated)
| join kind= inner (
   PesterResult_CL
) on BatchId_g
While the most recent batch is a pretty common requirement, you may have different batch sizes (people running ad-hoc tests in the day are one example of smaller batches). One method I've used to find the most recent complete batch -is to look for queries that contain more than N results - I know my typical SQL checks have 900 tests, so the below query lets me filter out any small ad-hoc or incomplete batches:
PesterResult_CL
| where TimeGenerated > ago(7d)
| where Identifier_s == "SQLChecks"
| summarize testCount = count(), maxTime = max(TimeGenerated) by BatchId_g
| where testCount > 900
| top-nested 1 of BatchId_g by max(maxTime)
| join kind= inner (
   PesterResult_CL
) on BatchId_g
Showing failures only
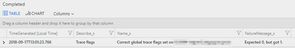
When there are failures, you can quickly view details by filtering on the boolean column Passed_b. The below projects only the essential columns:
PesterResult_CL
| where TimeGenerated > ago(7d)
| where Identifier_s == "SQLChecks"
| summarize testCount = count(), maxTime = max(TimeGenerated) by BatchId_g
| where testCount > 900
| top-nested 1 of BatchId_g by max(maxTime)
| join kind= inner (
   PesterResult_CL
) on BatchId_g
| where not(Passed_b)
| project TimeGenerated, Describe_s, Name_s, FailureMessage_s
In this specific example the result means that the trace flags configured on the server differ from the expected trace flags by a count of one.
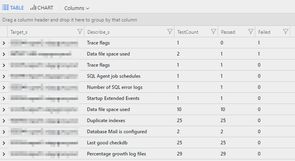
Showing batch aggregates
To look at the overall stats (tests, passed, failed) we can group by any set of columns - in the below example we're grouping by Target and Describe, and then ordering by the number of failed tests. This lets us quickly see which tests have failed and against what target.
PesterResult_CL
| where TimeGenerated > ago(7d)
| where Identifier_s == "SQLChecks"
| summarize testCount = count(), maxTime = max(TimeGenerated) by BatchId_g
| where testCount > 900
| top-nested 1 of BatchId_g by max(maxTime)
| join kind= inner (
   PesterResult_CL
) on BatchId_g
| summarize TestCount = count(), Passed = sumif(1,Passed_b), Failed = sumif(1,not(Passed_b))  by Target_s, Describe_s
| order by Failed desc
In this case it looks like we have some data file space issues in addition to the trace flag problem.
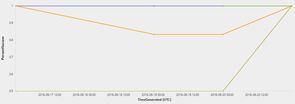
Showing test or machine history
We might want to look at how a single test is performing over the estate. The below query shows the status of the Data file space used Describe by percent success (0% = all tests failed, 100% = all tests passed), split by target. Note we multiply the count by 1.0 to turn it into a float, rather than an integer (which would floor our result to always 0 or 1).
PesterResult_CL
| where TimeGenerated > ago(30d)
| where Identifier_s == "SQLChecks"
| where Describe_s == "Data file space used"
| summarize Passed = sumif(1,Passed_b), Total = count() * 1.0 by Target_s, bin(TimeGenerated, 1d)
| extend PercentSuccess = Passed / Total
| project TimeGenerated, Target_s, PercentSuccess
| render timechart
The below graph shows an example of a few targets which have never had a failure (yay!), one target which was partially failing (note the Y axis starts at 0.5) for a long time and recently was fixed, and another which partially failed and then recovered.
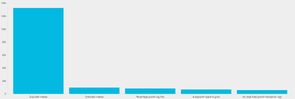
Finding the longest-running Describe block
If you're looking to performance tune your infrastructure tests, you'll want to know where the time is being spent. This final example shows how you can find which one of the describe blocks is taking the longest time to run. The example uses the most recent batch and plots the time taken in milliseconds for each describe block.
PesterResult_CL
| where TimeGenerated > ago(7d)
| where Identifier_s == "SQLChecks"
| top-nested 1 of BatchId_g by max(TimeGenerated)
| join kind= inner (
   PesterResult_CL
) on BatchId_g
| top-nested 5 of Describe_s by sum(TimeTaken_d)
| order by aggregated_Describe_s desc
| render barchart
In this example checking for
Duplicate Indexesdominates at almost 140 seconds.
Summary
Well done if you made it this far - if you're starting from scratch with your infrastructure testing there are a lot of steps needed to get here. The good news is that once you've gone through all this setup for your first set of tests, onboarding and analysing the results from subsequent tests is very easy.
By having all your Pester results stored in Log Analytics you're able to inspect the health of your estate now and historically very quickly, and can additionally share access to those test results directly (giving people the ability to write their own queries over your results), or create and share dashboards (perhaps leveraging the ability of Power BI to query Log Analytics). Some other options you have to leverage your results in Log Analytics include creating alerts with Azure Monitor (alert on Pester failures), or scheduling periodic reports with Flow (a daily summary of Pester results).
In the near future I'll be showing how you can use Pester to perform data validation checks too - the results will, of course, be shipped to Log Analytics for easy querying/monitoring/alerting.