Analysing blob storage metrics with Power BI
Every new storage account has Storage Analytics enabled by default, which captures both logs and metrics relating to that storage account. The metric data is logged into a table in the storage account, which is used to power the metrics you see in the portal but can also be downloaded and used programmatically, by a tool like storage explorer, or with Power BI.
I recently found myself investigating why the cost of a resource group was so high (relative to expectations), and the driver turned out to be blob storage. As this application was supposed to be storing less than 1MB of data that was a surprise, and it was an even bigger surprise when the driver turned out to be the request charge.
In order to drill a level deeper than the billing API (which only reports requests/day), I built a Power BI template to understand what was happening to the storage account. This template can be used to analyse any storage account, and reports on capacity, requests by operation type, ingress and egress, as well as estimating costs.
You can download a copy of the template from this repo, or read on for more details about how to configure and use the report.
Using the Power BI template
To use the Power BI template you'll need Power BI Desktop, a copy of the template (latest version from this repo), and the storage account name and key.
When you open the template it will ask you to provide parameter values for the table endpoint. This typically takes the form https://storageaccountname.table.core.windows.net/ and can be found on the Properties blade of the storage account in the Azure portal. Note that even blob storage accounts have a table endpoint (the system uses table storage for all metrics, regardless of the kind of account).

Once you've provided the endpoint the template will connect and if this is the first time you've connected it will ask you for the account key. The account key can be found on the Access Keys blade of the storage account in the Azure portal.
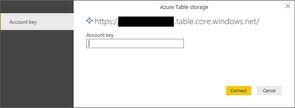
The template will then download the capacity and metric data from the account. If you now save the Power BI file it will be saved as a report (.pbix), and next time you open this report you won't have to supply the details. In this way, you can quickly create reports for your key storage accounts that you can open and refresh as needed.
Date range
The report will pull all available capacity and metric data from the storage account. By default this is seven days - you may want to consider increasing this on your storage accounts as the cost is negligible if you are only storing metrics rather than logs - read more on storage metrics cost).
Both pages of the report are filtered to the last seven days by default - you can modify the date range using the filter at the top right of each page. If you want to perform more granular filtering (e.g. for a given period of time) you will need to filter using the DateTime column from the appropriate table (Blob Capacity or Blob Metrics).
Capacity information is captured once per-day, and the metric data we're using is captured once per-hour. More information is available about the tables we're reading from in the Metrics Table Schema documentation.
Capacity & Metrics page
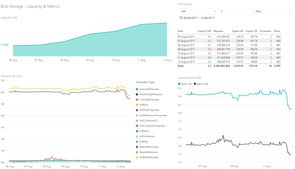
The first page of the report shows an overview of capacity, requests by type, and ingress/egress over time. By default, the requests and egress data is shown by the hour. If your storage account is only infrequently used (e.g. once per day) then graphs that are rendered by the hour may look odd. Hovering over any graph that is per-hour and clicking the Drill Up button in the top left will change the graph from per-hour to per-day. The image below shows the same graph before and after drilling up.
This happens because storage analytics will only create an entry in the metrics table if something happens - if your account has no activity it won't create an entry and our metric is then not contiguous (you'll have a record at midnight and then nothing until the next day at midnight). There are workarounds for this (use a different visualisation, render the missing data as 0, create a custom date/time axis, etc.) but drilling up typically works well.

Estimated Costs page
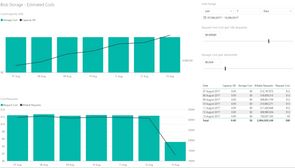
The second page of the report allows you to quickly check what the storage account should be costing (either per-month in the case of capacity, or per-hour/day for requests). Note that this is an exploration tool only - your bill is the only source of truth for the actual cost!
The estimation page makes use of 'What-If' parameters. If you slide the request unit cost or storage cost counters the graphs will update to show the expected price. This is useful when evaluating the potential cost impact of switching storage types (e.g. LRS to GRS).
Building the report
Below are some details on how the report was built and how you can reconstruct some/all of the report.
Getting the data
- Connecting to Table Storage (Get Data -> More -> Azure -> Azure Table Storage)
- Selecting an existing table (the storage analytics tables are hidden - if you don't have any existing tables you'll need to create one)
- Edit the query and then go to the advanced editor and replace the table name you selected with $MetricsHourPrimaryTransactionsBlob
- Name this query Blob Metrics
- Repeat the above but for the table $MetricsCapacityBlob and name the query Blob Capacity
Filtering out summary rows
You'll now have both datasets available. One thing to note is that the transaction metrics contains one row for every API call as well as a summary record (user;All and system;all). If you include these in any table/graph you'll be overstating your usage, so I suggest you either filter them out of the import, or you create a field which allows you to filter the summary rows out at the report level. To do this I split the RowKey column by delimiter (;) into two columns - Access Type (system/user) and Transaction Type (API called), and then created a custom column with the following DAX expression:
Transaction Type Group = IF([Transaction Type] = "all", "Summary", "Detail")
Applying a report filter to limit all rows to Detail then prevents any double-counting.
Date and time
To make working with dates easier (including correlating the capacity & transactions tables on a common date) the following steps should be taken when importing data:
- Format the partition key as a date/time, and rename to DateTime
- Create a copy of the formatted partition key column, format as a date, and rename to Date
- Complete these steps for both imported tables
Once the data is loaded you'll want to create a custom calendar table with the DAX expression:
Date = CALENDARAUTO()
And then use the modelling view to create relationships between the capacity and metrics tables to the date table. You should then use this date on all date axes.
Expressions and formatting
By default, all the capacity and transaction metric data comes in as strings. During the import process, you will want to format these as whole numbers. Once imported creating and formatting measures will ensure that people are actually able to read your report (I don't know about you, but total egress of 3565504437 doesn't mean as much to me as 3.5GB). Some example measures I used:
Capacity B = SUM([Capacity])
Capacity MB = [Capacity B]/1024/1024
Capacity GB = [Capacity MB]/1024
For the costing data, my measures were all formatted as currency (USD) - you'll want to pick whatever currency your subscription is in, or use a decimal and ignore that.
What-if
To build the what-if functionality (e.g. cost per GB stored) you'll need to first create a what-if parameter. At the time of writing monthly blob storage costs range from $0.0224 to $0.061 per GB. To allow report users to explore this range we'll create a parameter that lets us go from 0.02 to 0.07 in 0.0001 increments (Modelling -> What If -> New Parameter):
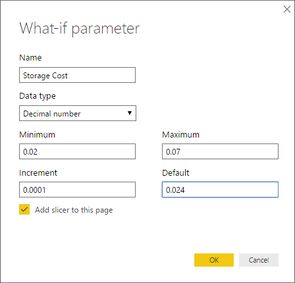
Creating this will create a new table that has the series as well as the measure that returns the current value (based on any filters/slicers/calculation context). Note that the window is a shortcut to creating the table/expressions manually. Once we have the measure to compute cost we can then go on to create a measure to calculate the estimated monthly storage cost.
Storage Cost = GENERATESERIES(0.02, 0.07, 0.0001)
Storage Cost Value = SELECTEDVALUE('Storage Cost'[Storage Cost], 0.024)
Monthly Storage Cost = [Capacity GB]*[Storage Cost Value]
Parameterising the table endpoint
To parameterise the table endpoint a new parameter needs to be created in Edit Queries. Once created you can then edit the source step (double click the first step of each table import) and you'll be able to select from value or parameter:

You can manage the parameter value from the edit queries page (it will appear alongside tables and functions). When you export the report as a template it will then prompt for all parameter values when the template is first opened.
Browsing Azure Storage
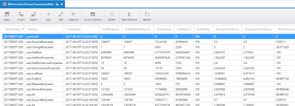
For exploring Azure storage I highly recommend Storage Explorer, which will also show hidden tables and containers. The screenshot below shows an example of the $MetricsHourPrimaryTransactionsBlob table viewed with storage explorer.
The full text of the M queries in the template is included below. They both expect a parameter called TableEndpointURL.
M Queries
Blob Metrics
let
    Source = AzureStorage.Tables(TableEndpointURL),
    BlobMetrics = Source{[Name="$MetricsHourPrimaryTransactionsBlob"]}[Data],
    ExpandedBlobMetrics = Table.ExpandRecordColumn(BlobMetrics, "Content", {"TotalRequests", "TotalBillableRequests", "TotalIngress", "TotalEgress", "Availability", "AverageE2ELatency", "AverageServerLatency", "PercentSuccess", "PercentThrottlingError", "PercentTimeoutError", "PercentServerOtherError", "PercentClientOtherError", "PercentAuthorizationError", "PercentNetworkError", "Success", "AnonymousSuccess", "SASSuccess", "ThrottlingError", "AnonymousThrottlingError", "SASThrottlingError", "ClientTimeoutError", "AnonymousClientTimeoutError", "SASClientTimeoutError", "ServerTimeoutError", "AnonymousServerTimeoutError", "SASServerTimeoutError", "ClientOtherError", "AnonymousClientOtherError", "SASClientOtherError", "ServerOtherError", "AnonymousServerOtherError", "SASServerOtherError", "AuthorizationError", "AnonymousAuthorizationError", "SASAuthorizationError", "NetworkError", "AnonymousNetworkError", "SASNetworkError"}, {"TotalRequests", "TotalBillableRequests", "TotalIngress", "TotalEgress", "Availability", "AverageE2ELatency", "AverageServerLatency", "PercentSuccess", "PercentThrottlingError", "PercentTimeoutError", "PercentServerOtherError", "PercentClientOtherError", "PercentAuthorizationError", "PercentNetworkError", "Success", "AnonymousSuccess", "SASSuccess", "ThrottlingError", "AnonymousThrottlingError", "SASThrottlingError", "ClientTimeoutError", "AnonymousClientTimeoutError", "SASClientTimeoutError", "ServerTimeoutError", "AnonymousServerTimeoutError", "SASServerTimeoutError", "ClientOtherError", "AnonymousClientOtherError", "SASClientOtherError", "ServerOtherError", "AnonymousServerOtherError", "SASServerOtherError", "AuthorizationError", "AnonymousAuthorizationError", "SASAuthorizationError", "NetworkError", "AnonymousNetworkError", "SASNetworkError"}),
    ChangeInitialTypes = Table.TransformColumnTypes(ExpandedBlobMetrics,{ {"PartitionKey", type datetime}, {"TotalRequests", Int64.Type}, {"TotalBillableRequests", Int64.Type}, {"TotalIngress", Int64.Type}, {"TotalEgress", Int64.Type}, {"Availability", Int64.Type}, {"AverageE2ELatency", Int64.Type}, {"AverageServerLatency", Int64.Type}, {"PercentSuccess", Int64.Type}, {"PercentThrottlingError", Int64.Type}, {"PercentTimeoutError", Int64.Type}, {"PercentServerOtherError", Int64.Type}, {"PercentClientOtherError", Int64.Type}, {"PercentAuthorizationError", Int64.Type}, {"PercentNetworkError", Int64.Type}, {"Success", Int64.Type}, {"AnonymousSuccess", Int64.Type}, {"SASSuccess", Int64.Type}, {"ThrottlingError", Int64.Type}, {"AnonymousThrottlingError", Int64.Type}, {"SASThrottlingError", Int64.Type}, {"ClientTimeoutError", Int64.Type}, {"AnonymousClientTimeoutError", Int64.Type}, {"SASClientTimeoutError", Int64.Type}, {"ServerTimeoutError", Int64.Type}, {"AnonymousServerTimeoutError", Int64.Type}, {"SASServerTimeoutError", Int64.Type}, {"ClientOtherError", Int64.Type}, {"AnonymousClientOtherError", Int64.Type}, {"SASClientOtherError", Int64.Type}, {"ServerOtherError", Int64.Type}, {"AnonymousServerOtherError", Int64.Type}, {"SASServerOtherError", Int64.Type}, {"AuthorizationError", Int64.Type}, {"AnonymousAuthorizationError", Int64.Type}, {"SASAuthorizationError", Int64.Type}, {"NetworkError", Int64.Type}, {"AnonymousNetworkError", Int64.Type}, {"SASNetworkError", Int64.Type} }),
    DuplicatePartitionKey = Table.DuplicateColumn(ChangeInitialTypes, "PartitionKey", "Date"),
    SplitRowKey = Table.SplitColumn(DuplicatePartitionKey, "RowKey", Splitter.SplitTextByDelimiter(";", QuoteStyle.Csv), {"Access Type", "Transaction Type"}),
    ChangeFinalTypes = Table.TransformColumnTypes(SplitRowKey,{ {"Date", type date}, {"Access Type", type text}, {"Transaction Type", type text} }),
    RenamePartitionKey = Table.RenameColumns(ChangeFinalTypes,{ {"PartitionKey", "DateTime"} })
in
    RenamePartitionKey
Blob Capacity
let
    Source = AzureStorage.Tables(TableEndpointURL),
    BlobCapacity = Source{[Name="$MetricsCapacityBlob"]}[Data],
    BlobCapacityExpanded = Table.ExpandRecordColumn(BlobCapacity, "Content", {"Capacity", "ContainerCount", "ObjectCount"}, {"Capacity", "ContainerCount", "ObjectCount"}),
    ChangePartitionKeyType = Table.TransformColumnTypes(BlobCapacityExpanded,{ {"PartitionKey",type datetime} }),
    DuplicatePartitionKey = Table.DuplicateColumn(ChangePartitionKeyType, "PartitionKey", "Date"),
    RenamePartitionKey = Table.RenameColumns(DuplicatePartitionKey,{ {"PartitionKey", "DateTime"} }),
    ChangeTypes = Table.TransformColumnTypes(RenamePartitionKey,{ {"Date", type date}, {"Capacity", Int64.Type}, {"ContainerCount", Int64.Type}, {"ObjectCount", Int64.Type} })
in
    ChangeTypes
Updates and suggestions
If you have any suggestions for the report (either formatting, measures, default reports) please let me know.
The version of the template used when building this blog post can be downloaded here (the version on github may have since been updated).