Understanding space usage in Azure Monitor logs
Data ingested to Azure Monitor logs is billed per-Gigabyte ingested. As a workspace will typically grow to have data coming from many different sources and solutions it is helpful to have a set of queries that allow you to quickly drill into where exactly the GBs (or TBs!) of data you have stored comes from.
I've found the below queries very helpful starting points for three main scenarios:
- Regular monitoring (once/month) to see how data volumes are trending
- Reacting to a monitoring alert based on overall ingestion volumes
- Testing out a configuration change/new solution and observing the impact on data ingested
The latter is particularly important before rolling a change to a workspace with long retention - you wouldn't want (hypothetically :)) to accidentally ingest 100GB of IIS logs and then be forced to retain them for 2 years...
Workspace solution/data type usage
This query provides a summary of the top solutions and data types in a single workspace, along with how they contribute to overall usage. If your workspace has a lot of different solutions or data types you'll benefit from changing the values passed to the top-nested operators.
Usage
| where TimeGenerated > startofday(ago(30d)) and TimeGenerated < startofday(now())
| where IsBillable
| top-nested 1 of 'All' by AllData = round(sum(Quantity),0)
, top-nested 2 of Solution with others='Others' by SolutionTotal = round(sum(Quantity), 0)
, top-nested 2 of DataType with others = 'Others' by SolutionDataTotal = round(sum(Quantity), 0)
| where AllData != 0
| extend SolutionPct = round((SolutionDataTotal / SolutionTotal) * 100, 1)
| extend OverallPct = round((SolutionDataTotal / AllData) * 100,1)
| project AllData, SolutionTotal, Solution, DataType, SolutionPct, SolutionDataTotal, OverallPct
| order by OverallPct desc
A couple of example results are below - one for a security focused workspace, and one for a workspace which has a bit more going on.

We can see here that this workspace is dominated by the Security event log - almost 70% of all the data is the SecurityEvent data type in the Security solution. This corresponds to the Windows Security Event Log records that are uploaded.

This workspace demonstrates how the top-nested operator works. Inside of the LogManagement solution we've got 2 distinct data types (Perf and a Custom Log - the one ending in _CL). We've also got the 'Others' record which tells us that the longer tail of data types in that solution might be worth looking at as they comprise nearly 30% of the solution total, and 15% of overall data.
Workspace data over time
If you have multiple workspaces it can be helpful to see how their data trends over time. Extending this query to run over additional workspaces is unfortunately a matter of copy-paste:
workspace("primaryWorkspace").Usage
| where TimeGenerated > startofday(ago(30d)) and TimeGenerated < startofday(now())
| where IsBillable
| extend Workspace = "Primary"
| summarize sum(Quantity) by Solution, bin(TimeGenerated, 1d), DataType, Workspace
| union (
workspace("secondaryWorkspace").Usage
| where TimeGenerated > startofday(ago(30d)) and TimeGenerated < startofday(now())
| where IsBillable
| extend Workspace = "Secondary"
| summarize sum(Quantity) by Solution, bin(TimeGenerated, 1d), DataType, Workspace
)
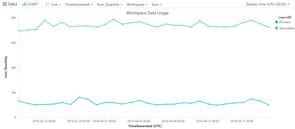
| render timechart with(title = 'Workspace Data Usage')
In this example the primary workspace is responsible for capturing data which will be retained for a long period of time, and the secondary workspace captures higher volume data. Use the dropdown to change between viewing by Workspace, Solution or Data Type.

Note the usage of
startofday(...)when filtering onTimeGenerated. Cutting boundaries at midnight at the start/end removes weird artefacts where the graph looks like it is unusually low due to only part of a day's data being counted.
Drilling into a single data type
At some point a graph will invariably point to something that looks a little weird - an upward trend or maybe a huge spike - and you'll want to understand where that is coming from. The good news is Azure Monitor logs provides a pair of virtual columns _IsBillable and _BilledSize that let you drill in to any data type and find out exactly what it is costing you.
Event
| where TimeGenerated > startofday(ago(30d)) and TimeGenerated < startofday(now())
| where _IsBillable == true
| extend computerName = tolower(tostring(split(Computer, '.')[0]))
| where computerName != ""
| summarize TotalVolumeMB = sum(_BilledSize / 1024 / 1024) by computerName, bin(TimeGenerated, 1d)
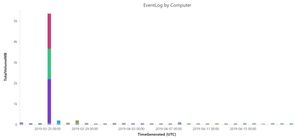
| render barchart with(title = 'EventLog by Computer')
In this example assume we discovered the Event data type in a particular workspace had a spike - running the query should tell us quickly if this was limited to a single server or all servers. And as you can see below there were three servers that had a very eventful day a little while back!

Further reading
The official docs are a great place to start reading more about space usage and monitoring for Azure Monitor logs. I've also put a couple of queries on GitHub that I'll update over time as I find any better ways of cutting this data.