Monitoring your GatsbyJS bundle size
Gatsby will do a great job of serving up a well optimized site - but it is constrained by what you told it to serve. If keeping your site lean is important to you, then looking at your bundle size (and what's in that bundle) before and after adding any new dependencies can be illuminating. If you're currently happy with performance (hundreds dof kilobytes of JavaScript can be added and you'll still score a perfect 100 on a web.dev test) then I highly recommend Dan Luu's web bloat. After you've read that and now feel duly chastened about the state of the modern web, let's look at two ways to analyze your Gatsby site's bundle - interactive, and build-time reports.
Configuring the webpack size plugin
There are a couple of Gatsby plugins which will add webpack-bundle-analyzer for you, though I've opted to consume that package directly.
Gatsby plugins that are wrappers for other packages can be really hit or miss. Will they expose all the features you want, and be updated in a timely manner? In many cases I've opted to consume the packages directly and skip the Gatsby plugin as the amount of code needed is small and I appreciate the opportunity to learn more about the bundler and the analyzer plugin. If you prefer to stick with Gatsby plugins then I'd suggest gatsby-plugin-webpack-bundle-analyser-v2.
First of all you'll need to install the plugin (I'm using yarn in my examples):
yarn add webpack-bundle-analyzer -DNext you need to add the following to gatsby-node.js:
const BundleAnalyzerPlugin =
  require("webpack-bundle-analyzer").BundleAnalyzerPlugin;

exports.onCreateWebpackConfig = ({ stage, actions }) => {
  const analyzerMode = process.env.INTERACTIVE_ANALYZE ? "server" : "json";

  if (stage === "build-javascript") {
    actions.setWebpackConfig({
      plugins: [
        new BundleAnalyzerPlugin({
          analyzerMode,
          reportFileName: `./__build/bundlereport.json`,
        }),
      ],
    });
  }
};
The docs for onCreateWebpackConfig explain the different stages, and we only want to run the analyzer plugin when we're building our production JavaScript bundles (build-javascript) - this stage only runs during a gatsby build, and not during development.
The arguments we pass through are explained in the below sections and determine if we want to look at our bundle size interactively, or in a JSON report.
Viewing bundle sizes interactively
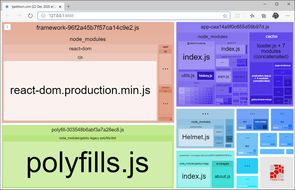
To explore the current state of your bundle I'd suggest running the analyzer in interactive mode. This will launch a server (defaulting to localhost:8888) that hosts an interactive treemap of your bundles:

To launch the analyzer in interactive mode we need to configure an environment variable (INTERACTIVE_ANALYZE). To support Windows we'll first add the cross-env package:
yarn add cross-env -DAnd we'll then add a new script that will launch the build process with this environment variable.
/* package.json */
scripts: {
  "analyze": "cross-env INTERACTIVE_ANALYZE=1 npm run build"
}
Once you run the analyze script the analyzer page will launch in a browser when the build process completes.
Something to keep in mind is that all of these bundles aren't loaded for every page/every browser. A good example is the polyfills.js bundle which won't be loaded on older browsers at all.
Reporting on bundle sizes at build time
By default every gatsby build will log the bundle stats to the file __build/bundlereport.json. You can see the current bundle stats for tjaddison.com.
If you don't want to upload your bundle report to your production site you can either gate the stats behind another environment variable (which you won't set for publishing).
Where this really shines is comparing releases - I use Netlify to deploy my site and take advantage of deploy previews to preview every pull request as a branch. This publishes my branch (including my bundlereport.json), which allows me to take those files and compare the bundle sizes of the branch compared to production.
As I make so few changes to the bundles right now I'm eyeballing the numbers - by using the below code I can print out the stats from production and a branch (in this case I'm comparing the before/after numbers from updating to tailwindcss 2.0 and bumping a few other dependencies):
const logParsedReport = (report) => {
  let parsedTotal = 0;
  let gzipTotal = 0;

  for (const file of report) {
    const { label, parsedSize, gzipSize } = file;
    parsedTotal += parsedSize;
    gzipTotal += gzipSize;
    console.log(`Name: ${label} - ${parsedSize} parsed (${gzipSize} gzip)`);
  }

  console.log("---------");
  console.log(`Total ${parsedTotal} (${gzipTotal} gzip)`);
};

const prod = "https://tjaddison.com/__build/bundlereport.json";
const branch =
  "https://5fc8401d8292a600084390dd--fervent-lovelace-f75e7a.netlify.app/__build/bundlereport.json";

fetch(prod).then((res) => {
  res.json().then((json) => {
    logParsedReport(json);
  });
});
fetch(branch).then((res) => {
  res.json().then((json) => {
    logParsedReport(json);
  });
});
This gives the following output (which I've truncated for brevity):
Name: 942fc3de6d17fbede2785a28a3625a2fd54381eb-469888aa0543c06173b4.js - 18354 parsed (6526 gzip)
Name: app-5ff60cbc19fc47db0c13.js - 66067 parsed (18874 gzip)
Name: component---cache-caches-gatsby-plugin-offline-app-shell-js-16703ee5599528db9f93.js - 499 parsed (351 gzip)
...
---------
Total 341617 (111583 gzip)

Name: 942fc3de6d17fbede2785a28a3625a2fd54381eb-0efa3ed3379b611c2795.js - 18152 parsed (6444 gzip)
Name: app-fd4d3ac6b7f96cbbf5f8.js - 74754 parsed (22347 gzip)
Name: component---cache-caches-gatsby-plugin-offline-app-shell-js-16703ee5599528db9f93.js - 499 parsed (351 gzip)
...
---------
Total 349385 (114705 gzip)
Happily this change has reduced the total bundle size - though as the code isn't actually doing a diff I couldn't tell you where. If you come up with a better piece of diffing code for the output please let me know!